Web Application to work on HVAC Plans and their Simplified Graph Representation
Contact: Michael Jungo
Overview
Heating, Ventilation and Air Conditioning (HVAC) systems require extensive planning to ensure that they function correctly and efficiently before they can be installed into a building. The resulting HVAC plans are complex technical drawings with a variety of symbols, sometimes with small visual differences, which are connected by fairly inconspicuous lines to indicate the flow of the water or air, respectively. These plans are not accompanied by an underlying machine-readable representation, i.e. the visual plan is the source of truth, therefore locating and identifying the symbols and their connections are crucial for the analysis of any given plan.
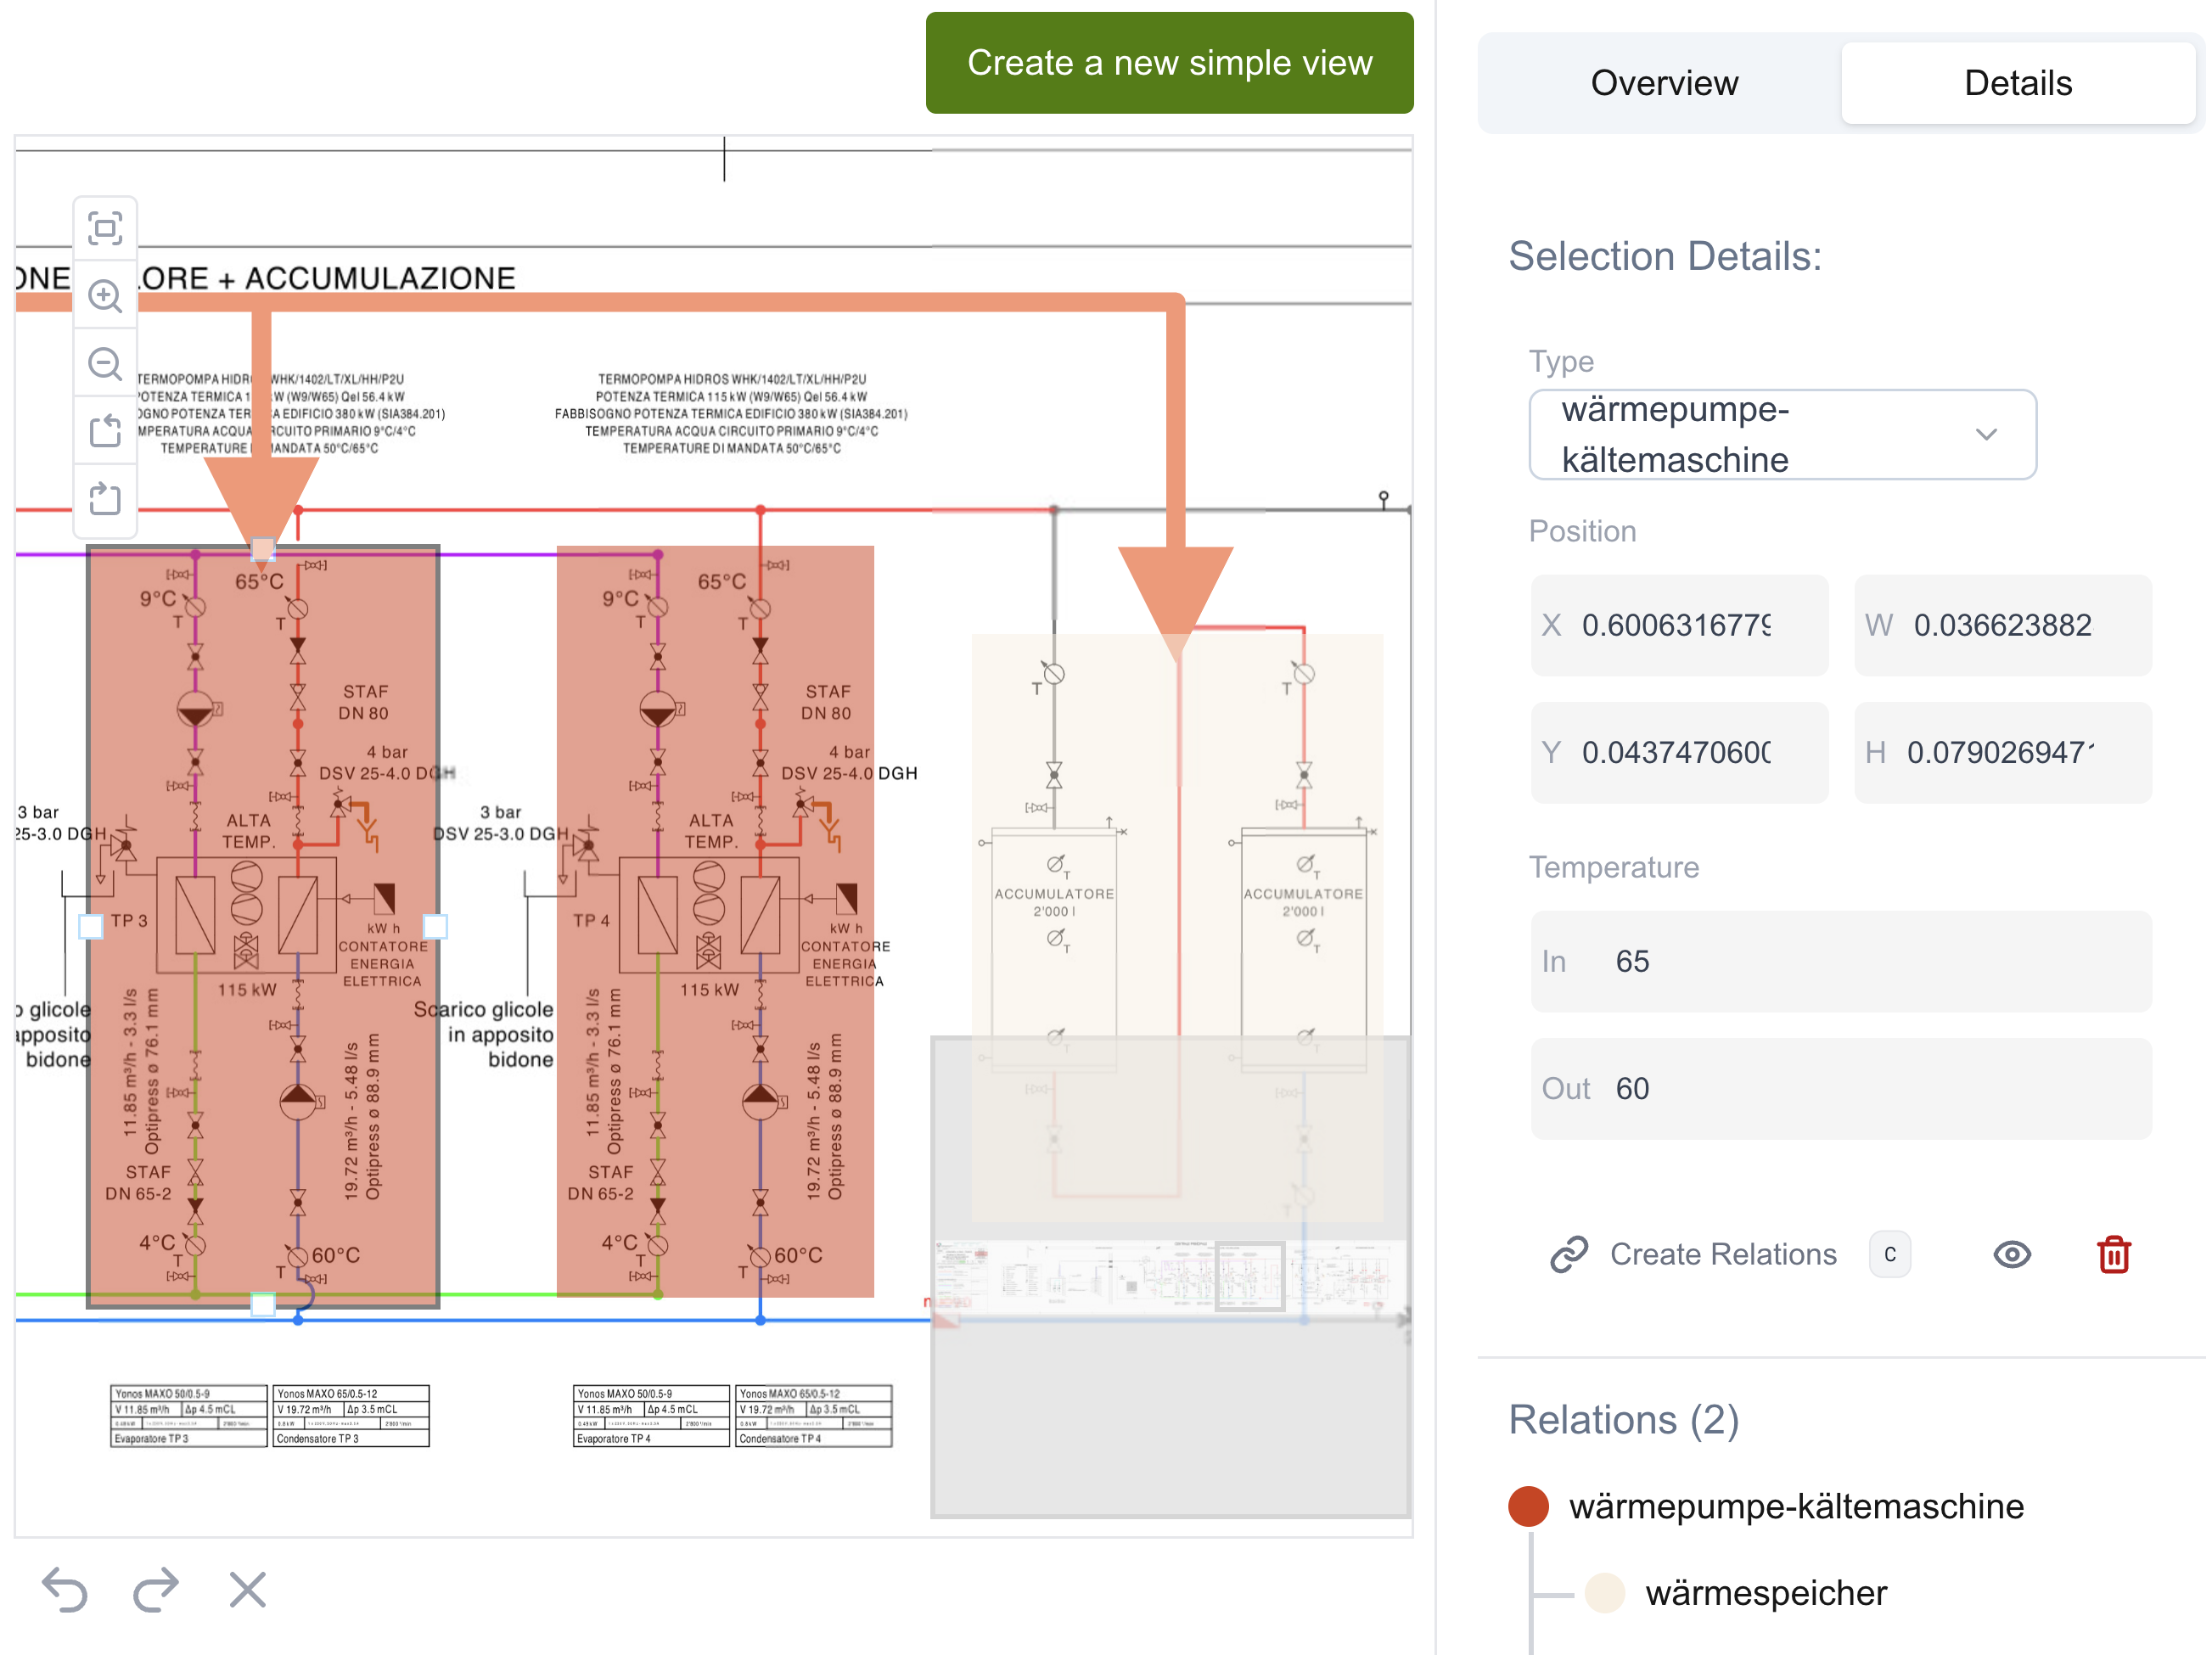
To facilitate the work on these plans, a collection of connected symbols form an autonomous component, such as a heating group, which we call function blocks. They are used as a higher level abstraction with the goal of making the plan much easier to digest for users that don’t need all the fine-grained details of every single element.
Each function block includes all the information necessary for controlling the contained devices to achieve its desired goal, such as heating up to a desired temperature, hence why they are autonomous. These information include the input/output temperatures, power, water flow and more. In order for the complete system to work correctly, the function blocks need to be connected as identified from the plan. This results in a graph, where the vertices/nodes are the function blocks and the edges are the connections between them.
The desired web application needs to provide the tools for the transition from a plan to a graph, such as drawing the bounding boxes for the function blocks, being able to connect them and fill out the necessary information within a function block.
Challenges
- The plans are notoriously large, especially wide, since they are regularly over 10'000 pixels long. Their size can cause issues, not only because it could take a long time to load it, especially with poor network conditions, but the navigation inside the browser can become sluggish and cause stuttering.
- Edges between function blocks need to be drawn in such a way that avoids overlapping or crossing any other function blocks or edges. The edge itself in the graph only provides the source and destination, not the exact coordinates of the full edge.
- A web app does not consist of the frontend alone, but needs a server, database and other services. The interaction between them is an additional source of complexity.
Objectives
- Design a software to work on HVAC plans with a graph representation for the function blocks.
- Implement a web application with a server and a database to handle large images.
- (Optional) Integrate a Machine Learning (ML) service, for example for the function block detection.
Methodology
- Analysis - Study the needs of the application and explore existing software to tackle certain challenges, such as large images or edge drawing for a graph.
- Design - Create a design for the full software stack to model the necessary components and their interactions.
- Implementation - Implement the web application and all the related components.
- Testing - Establish and perform tests to evaluate the features and robustness of the entire application.
- Reporting - Final thesis, presentation and optional publication.
Skills to be Acquired
- Designing a coherent software stack for a web application.
- Web Development in JavaScript/TypeScript.
- Managing services for the backend, such as a database.
Created: 27.03.2026